Skip to content
Excel E-Maps

Excel E-Maps

Mapping your data in Excel

Menu

  • Home
  • Specifications
    • E-Maps
    • E-Maps mobility
  • Tutorial
    • Quick start
      • Installing E-Maps
      • Starting E-Maps
    • Add data
      • Geocode
      • Coordinates
      • Shape
    • Manage layers
      • Layer control
      • Add labels
      • Point styling
    • Thematic maps
      • General
      • Thematic shading
      • Pie chart
      • Heatmap
    • Selection
      • Object selection
      • Boundary selection
    • Export
      • Project File
      • Clipboard
      • Print
      • PDF
      • Image
    • Other
      • Background map
      • Find location on map
      • Drawing
      • Statistics
      • ISO3 countrycodes
  • Buy now
  • Download
    • Download trial
    • Update page
    • Free data and maps
  • Support
    • Video’s
    • FAQ
    • Privacy Statement and Terms of Use
    • Newsletter
    • Contact
  • Nederlands

color picker

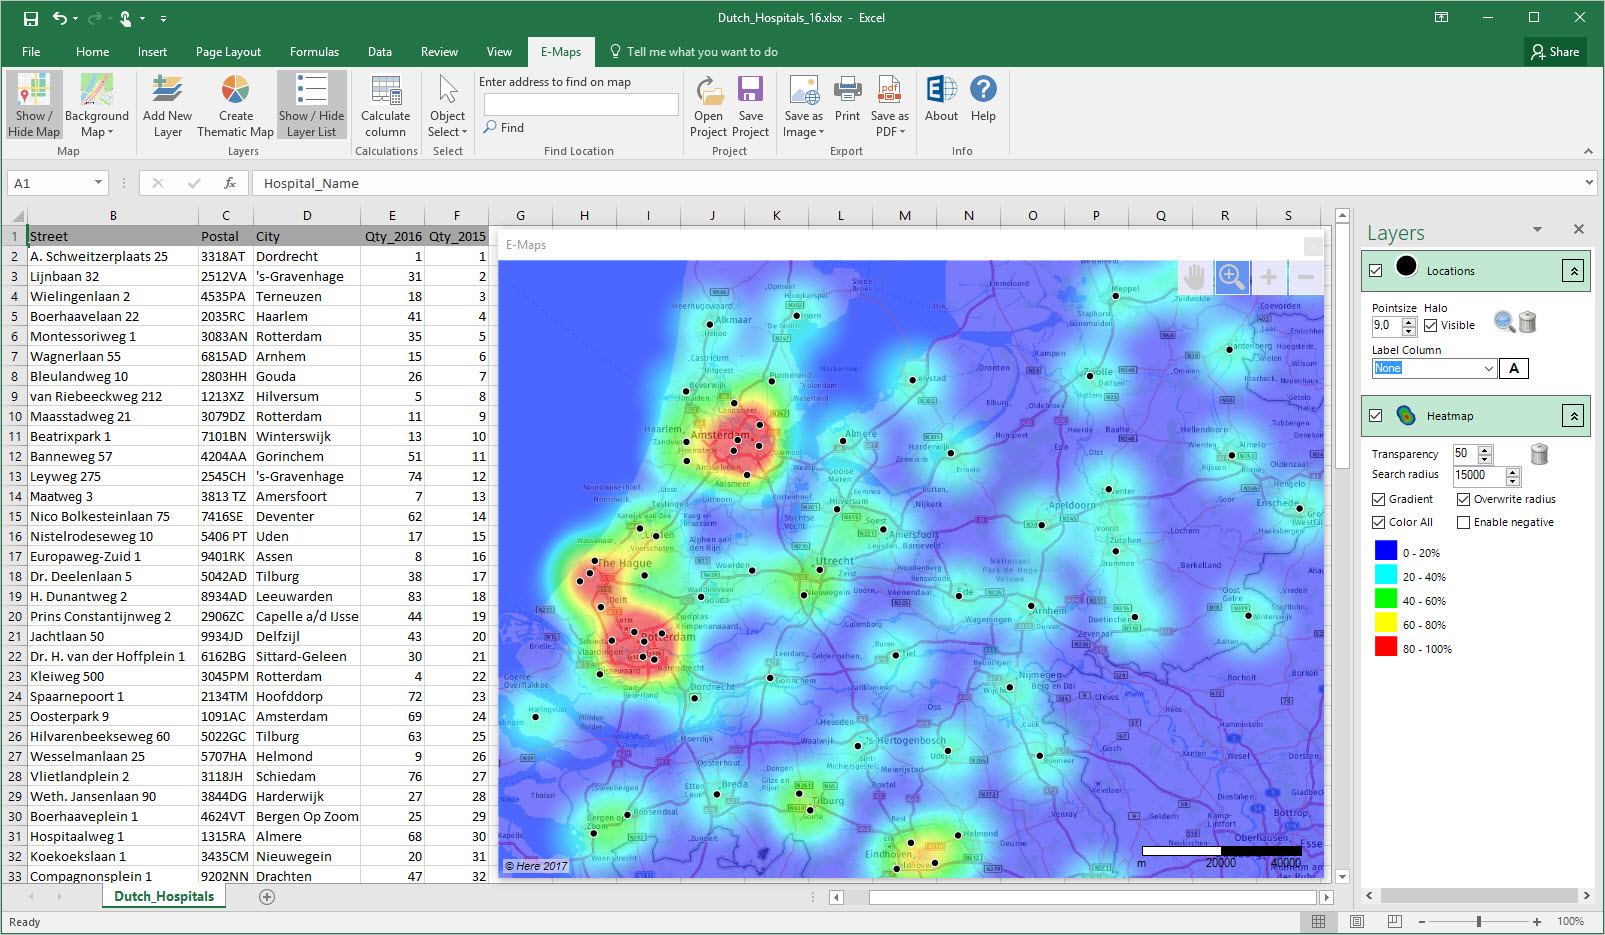
Adjustable colours and ranges in heatmap
heatmap

New heatmap settings Always wanted to change the colour scheme of the heatmap? Or do you need different colors to emphasize the importance of locations or negative values? Heatmaps are widely used to analyse and visualise density and intensity of data. E-Maps

Erik van Hunnik 27 May, 201624 August, 2021 Read more

Download

Read the License Agreement before you activate E-Maps.

Newsletter

    News

    • MapPoint
    • 45 seconds demo script
    • Three simplified maps
    • E-Maps Advanced for time and distance selections
    • The ruler
    • New symbols for thematic
    • Statistics of the selection
    • Circle selections are standard in E-Maps Pro
    • Adjustable colours and ranges in heatmap
    • Coffeeshops and schools in Amsterdam
    • New video tutorials for 2.0

    First Element Maerten 29, 2628 RC Delft, The Netherlands - Phone: +31 15 2190885 - Email: office@firstelement.nl