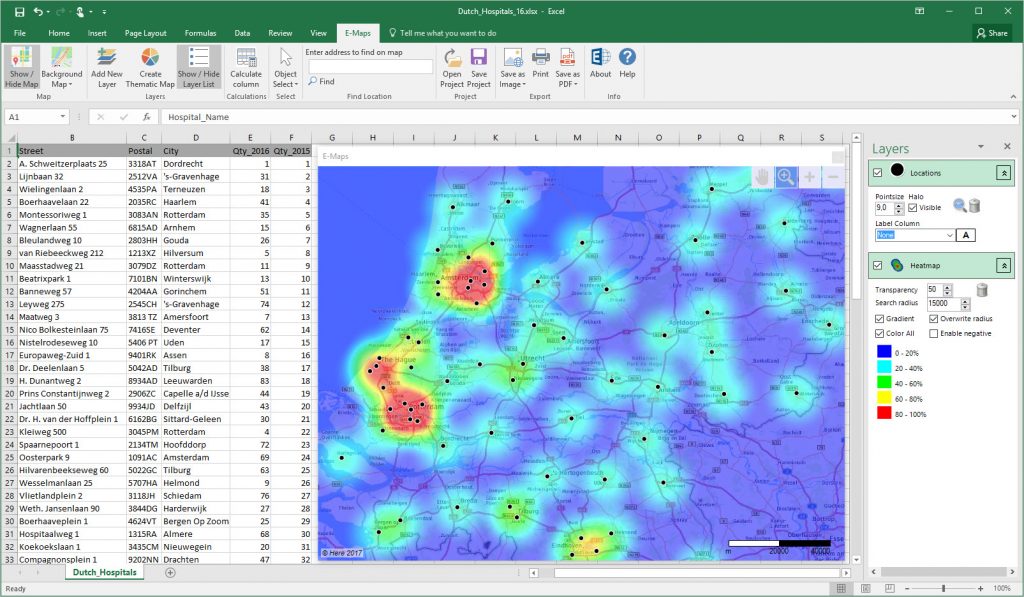
New heatmap settings

Always wanted to change the colour scheme of the heatmap? Or do you need different colors to emphasize the importance of locations or negative values?
Heatmaps are widely used to analyse and visualise density and intensity of data. E-Maps supports both heatmaps based on density and heatmaps based on a value of the data. Adjust the colours, the ranges and display negative values. Learn more about heatmaps in the manual.
E-Maps has baisc heatmap functionality in all versions. E-Maps Pro has the additional value based heatmaps. Discover the new specifications for heatmaps in Excel E-Maps.
Adjustable colours and ranges in heatmap
