
How to create a pie chart?

Select Create Thematic Map to start with creating a pie chart.
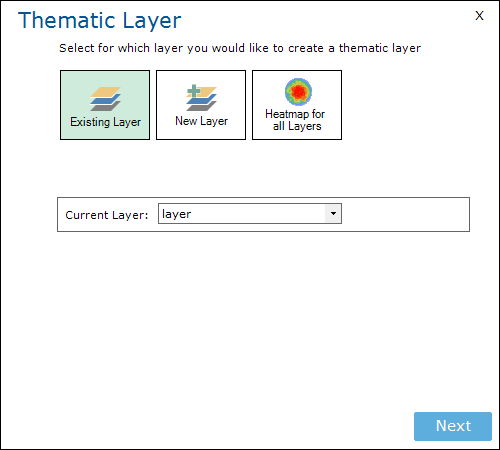
A window will appear where you can choose a layer, if you haven’t created you layer yet you can choose to create a New Layer. If you already have a layer select Existing Layer and select a layer at Current Layer.
Click Next.
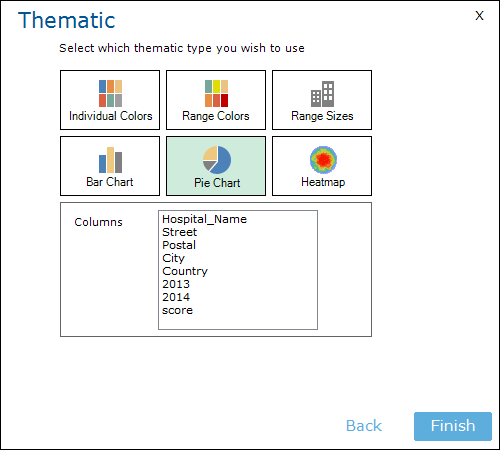
Select Pie Chart and select the colums from which you want to create the pie chart.
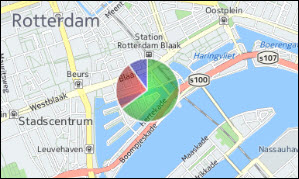
Click Finish and de map will show the created pie chart(s).
In layer control, you can personalize the style of the pie chart, like colour and size.