
How to create thematic shading for a boundary map?
This tutorial shows how to do thematic shading for a Shape (SHP) map in Excel. To create a thematic map, we first need a map layer for your Excel data using the Add Data steps. You can choose from data from geolocation or data from map coordinates. If you have a map layer you can continue.
Secondly we open your external shapefile (*.shp) in WGS84 format, this can be done by following the Import map tutorial.
We can now create the thematic shading for the boundary map.
Select the Create Thematic Map button.
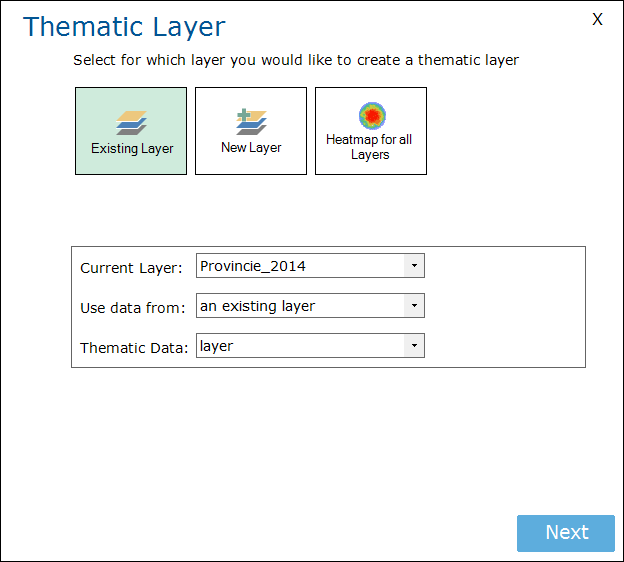
In the first step you need to select for which layer you woud like to create a thematic map. You can select an existing layer, create a new layer or create a heatmap which counts the points in all available layers. In the previous steps we already added layers, so we select Existing layer
After Current Layer, select the layer you would like to create a thematic map for. In this case we would like to apply thematic shading to our shapefile with areas.
You can choose to use data from the shapefile itself or use data from an other already added layer. If you choose the second option, you will need to select the date you would like to use. You can only use a non-thematic layer which is based on Excel data.
Click Next.
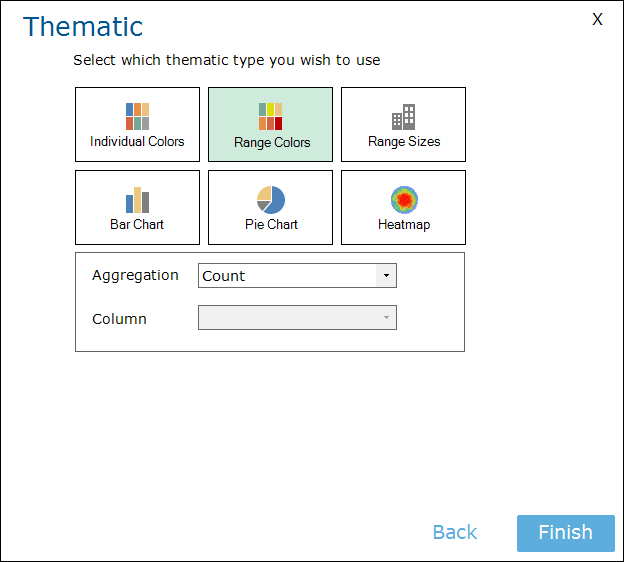
The last step is to select the type of thematic shading.
Individual colors: Based on an administrative value.
Range colors: Sum of a value in a column, count for the number of objects withtin each region.
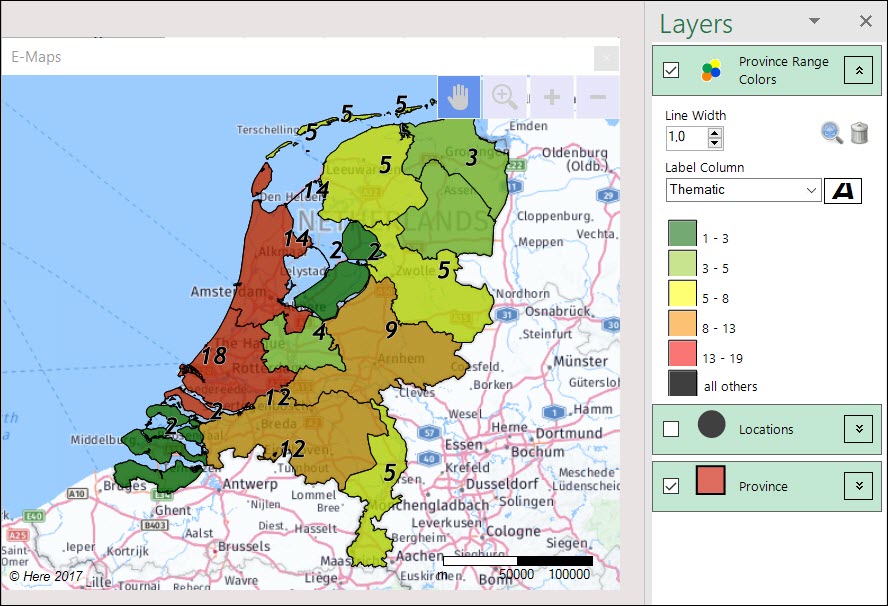
The result may look like this.
In the layer control you can change the ranges through clicking on the range values (for example 6.4 – 12.8) and set the start of the range. The previous value will change too.
Also a label column can be selected.
Videos
How to create a thematic map with Range Colors:
How to customize the Range Colors: