
How plot points from coordinates in Excel?

If you have your own coordinates in your data, you can start plotting points on the map right away.
Click on the Add New Layer button to start mapping coordinates.
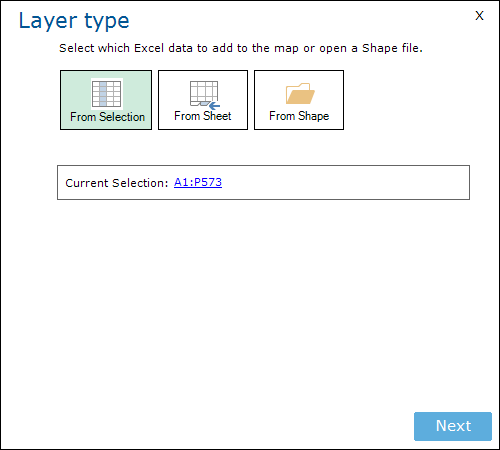
A window with three options will appear. You can use a (pre-) selected range to add as a map layer, an entire Excel data sheet, or a vector map layer in Esri Shape format.
Select your data (From Selection or From Sheet) and click Next.
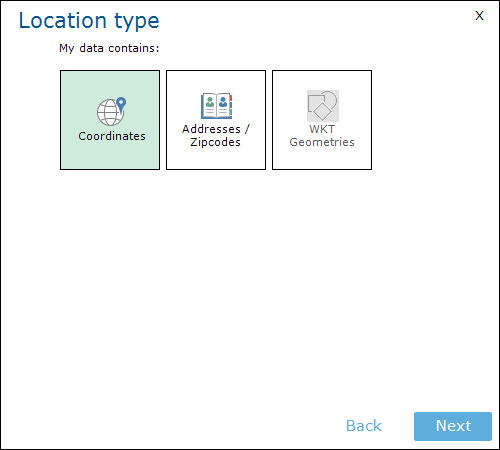
Select the Coordinates option.
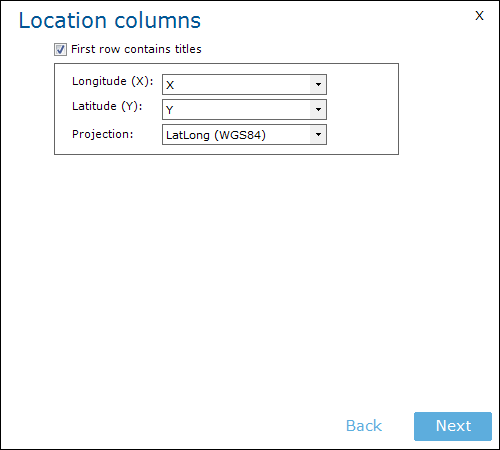
Select the columns that contain the coordinates. If E-Maps recognizes the column names, it will fill in the form for you.
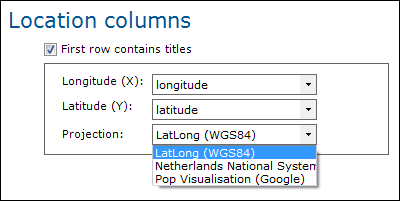
E-Maps has a choice of three types: Lat/Long WGS84, Dutch National system and Popular Visualisation.
Click Next.
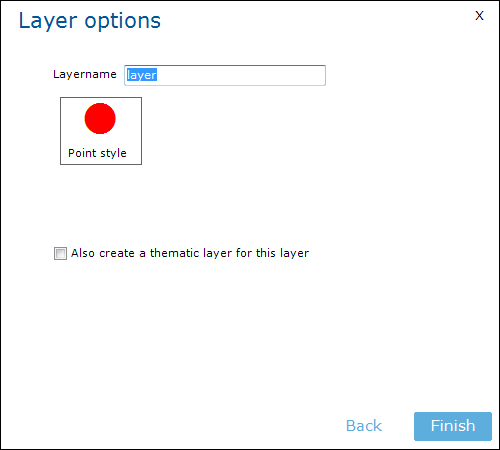
The LayerOptions will appear. In this menu, you can give a name to the layer and select a color type and symbol. More information about point styling can be found in the point styling tutorial.
Select Finish.
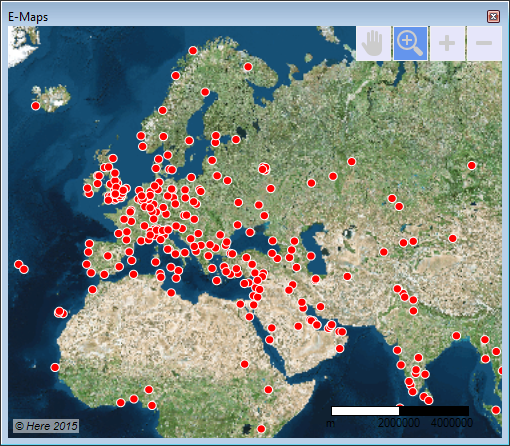
The map will appear with the selected data as points.
If you want a different appearance, change the point style in the Layercontrol.