
How to create a map with thematic points?
Before creating a thematic map of points, we first need a map layer for your Excel data using the Add Data steps. You can choose from data from geolocation or data from map coordinates.
Now we can create the thematic points map.

Click on Create Thematic Map.
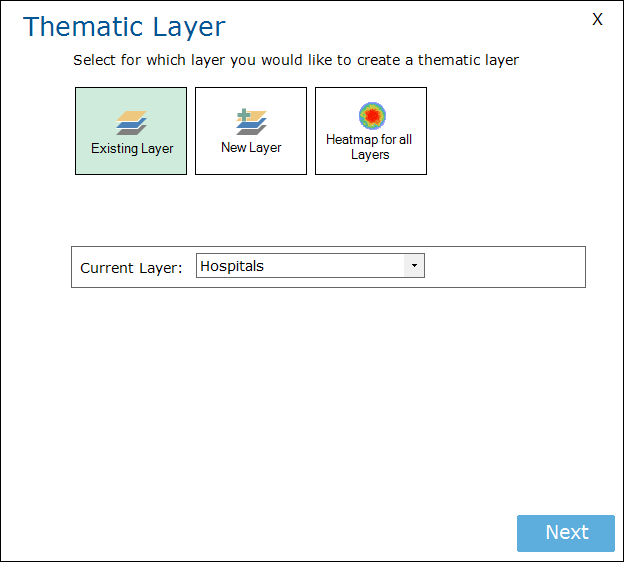
A window will appear which will ask for which layer you would like to create a thematic layer.
Select Existing Layer and select the layer you would like to use in the box after Current layer.
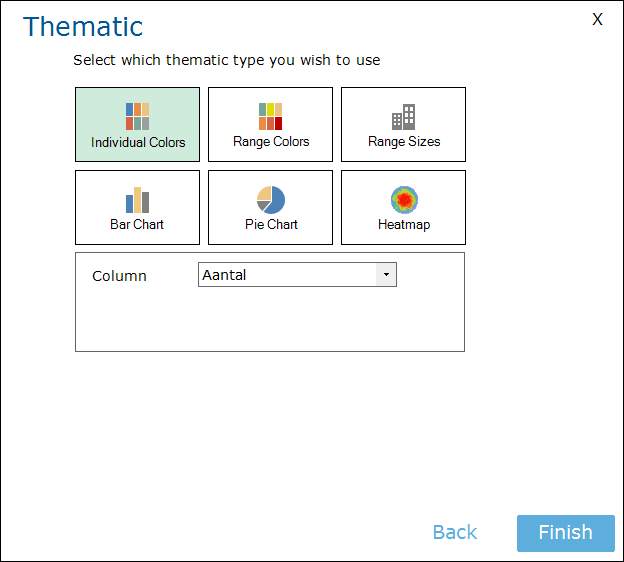
Next are the Thematic Options. Here you can choose the thematic type. The first three options, Individual Colors, Range Colors and Range Sizes, will result in thematic points. You need to select a column as well. This is the column that will be used to calculate the thematic color/size on the map.
At Individual Colors the colors are added to the points related to the cell text. E.g. Customer or Prospect. Each value will get a different color, points with the same value will get the same color.
At Range Colors the point on the map will be colored related to the value mentioned in the cell. The range of values will be divided into 5 equal categories, with each categorie having its own color.
At Range Sizes the point on the map will have a size related to the value mentioned in the cell. The range of values will be divided into 5 equal categories, with each categorie having its own size. Condition is the availability of a column with numbers to be selected.
At Bar Chart the point on the map will display a bar chart. The bar chart has vertical rectangular bars with lengths proportional to the values that are linked to the point. The size, colour and transparency can be adjusted.
You can also create Pie Charts and Heatmaps.
More information about Thematic Shading can be found here.